M7 Blog Post 6
As part of the new standards within science, my students explored climate change in depth. Part of this topic included ocean acidification, in which students discovered how the various spheres that make up the Earth would be affected, including the biosphere, hydrosphere and atmosphere. In this simulation, students manipulate the model to explore the relationship between atmospheric CO2 concentrations and pH levels. In this activity, students were able to explore current concerns regarding our Earth through a simulation while simultaneously gaining a new understanding and perspective (Bradley & Kendall, 2015).
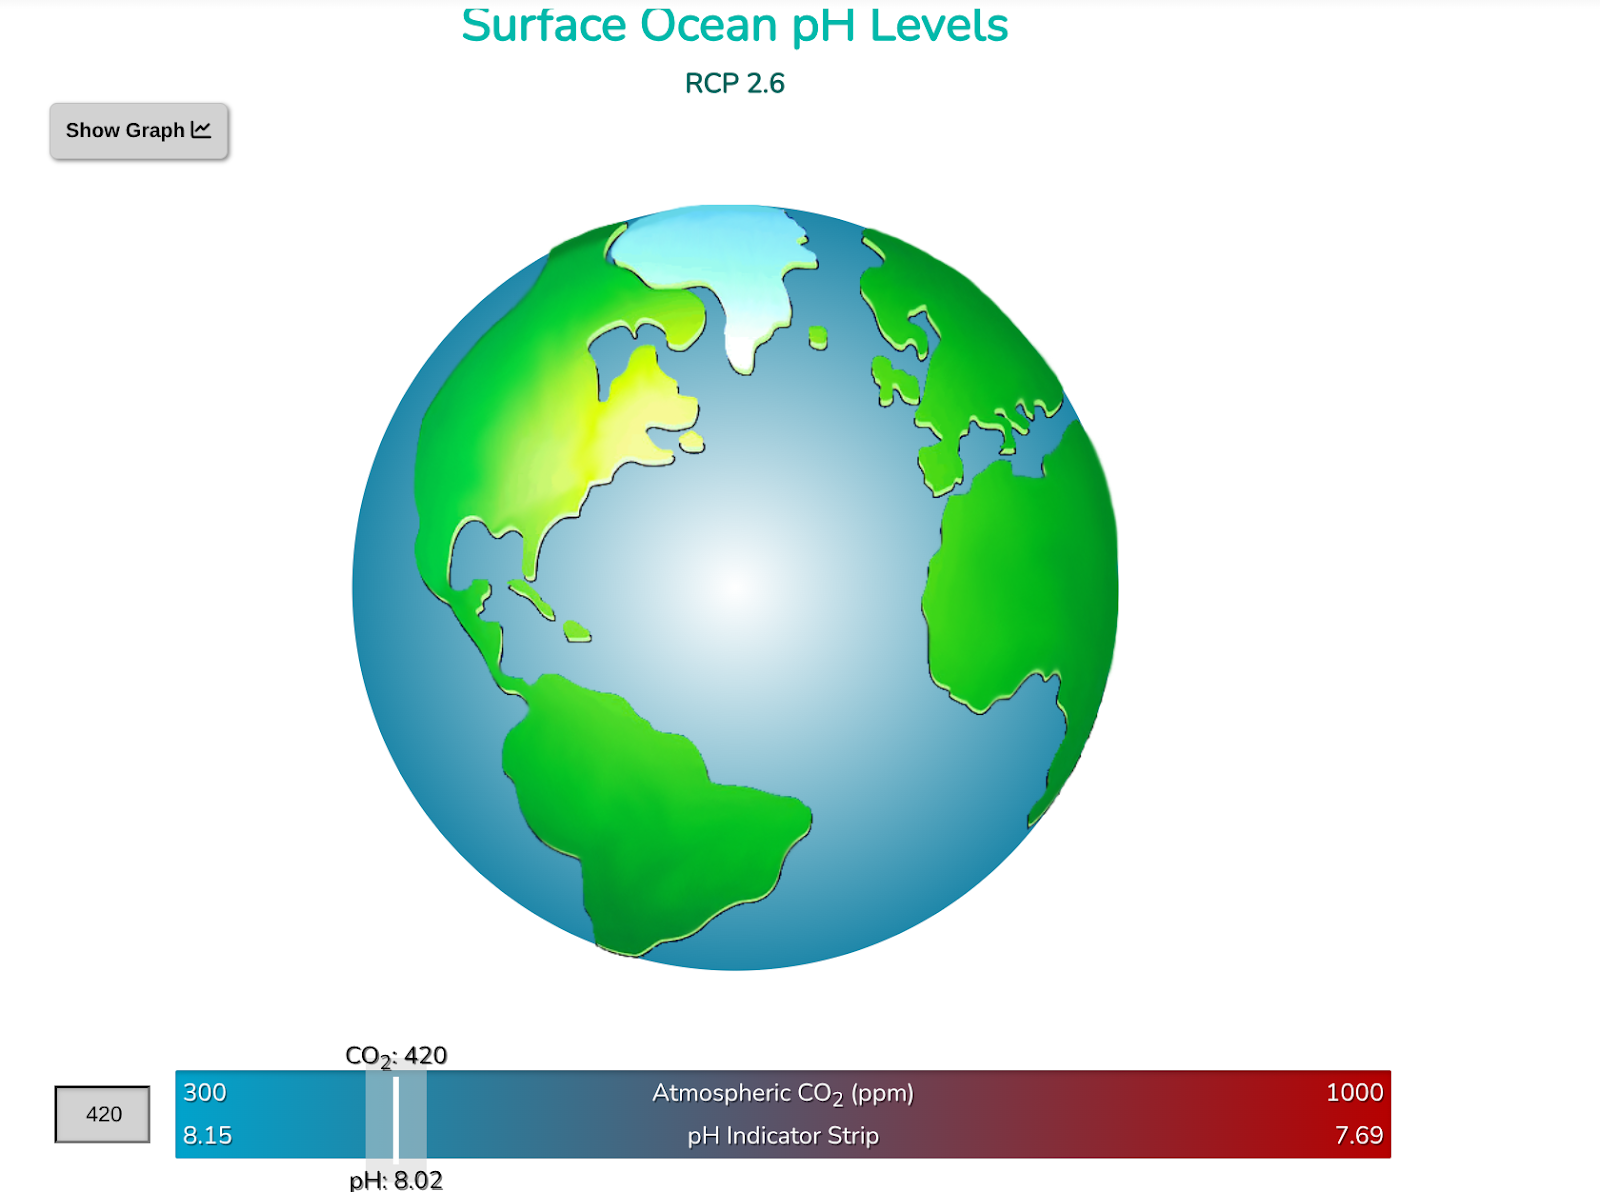
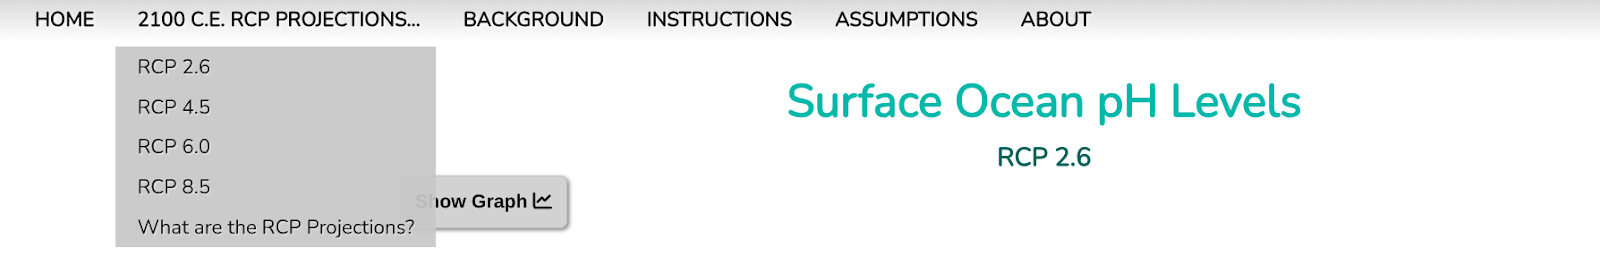
This simulation was completed during a lab, in which students had prior knowledge about Representative Concentration Pathways (RCP values). One of the huge appeals to utilizing this simulation was the fact that students could manipulate the simulation to explore RCP projections. In doing so, students were able to connect their prior knowledge to a new concept to form a deeper understanding. When exploring the various RCP projections, students were able to see that an RCP value of 2.6 would result in mild changes, while an RCP value of 8.5 would result in severe changes. This activity was perfect, as it met the New York State Science Learning Standard HS-ESS 3-6, in which students “Use a computational representation to illustrate the relationships among Earth systems and how those relationships are being modified due to human activity.” (New York State P-12 Science Learning Standards). Prior to this activity, students already learned how humans are impacting the Earth to cause such changes in our atmosphere and oceans. Using a computational model not only met the required standard, but also helped to prepare students for the future. This is important, as 21st century thinking requires “current knowledge and skills, but also preparation for future learning.” (Gee & Shaffer, 2010, p.3).
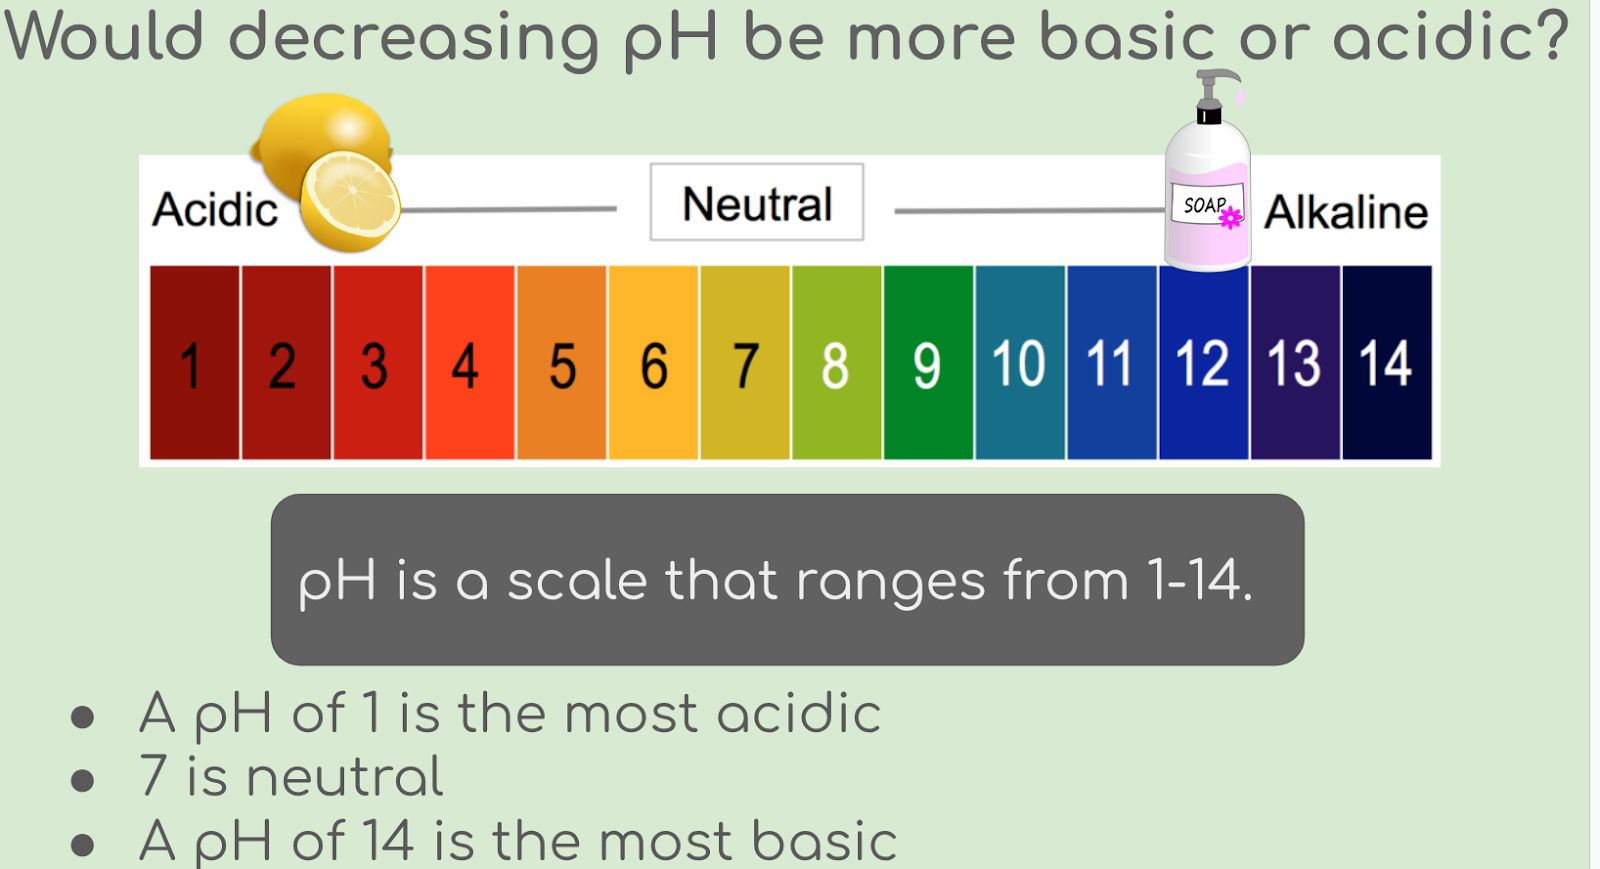
This activity was introduced by first reviewing pH. This was a necessary scaffold as students must understand the pH scale to analyze the relationship between atmospheric CO2 concentrations and oceanic pH levels. In doing so, I was able to assess the student's current understanding to determine if we were ready to proceed as a class.
Literacies and learning goals were assessed through the completion of the lab, in which students answered in depth questions regarding ocean acidification, the food chain, inputs and outputs within the hydrosphere, biosphere and atmosphere, and potential future implications. Such questions required students to have a deep understanding of prior knowledge as well as the content explored within the lab. Upon completing the lab students participated in a class discussion to share what they learned, in addition to anything that may have surprised them. The following day, our Do Now question readdressed some of the main ideas explored in the lab.
References:
Bradley and Kendall (2015). A Review of Computer Simulations in Teacher Education. Journal of Educational Technology Systems, 43(1) 3-12.
This looks like a great activity to look at the effects of increasing atmospheric CO2. I like that you also scaffold pH for your students. This would need to be something I do myself for my middle school students, especially since it is a topic of math they haven't learned yet. A good reminder of what the things is that is being effected can help the students understand the effect it self.
ReplyDelete